
The end of 2022 brought about a long-delayed but pivotal moment for global biodiversity: the adoption of the Kunming-Montreal Global Biodiversity Framework (GBF) at the United Nations (UN) Biodiversity Conference.
At what was formally known as the 15th meeting of the Conference of the Parties to the Convention on Biological Diversity, or COP15, leaders from around the world committed to new goals for safeguarding biodiversity and its contributions to people.
These replace the previous Aichi Biodiversity Targets that were set in 2010.
The new framework sets ambitious goals to enhance ecosystem integrity, prevent extinctions and loss of genetic diversity, and support inclusive and equitable conservation approaches.
What was achieved includes the following:
- Nearly 200 nations made a global and measurable commitment to halt and reverse biodiversity loss by 2030.
- They adopted a target to protect 30 percent of land, inland waters, and the ocean by 2030. This target recognizes the rights and leadership of Indigenous peoples and local communities while more than doubling and quadrupling the current levels of protection for land and sea, respectively. (This target was inspired by Edward O. Wilson’s call to protect “half” of nature for global biodiversity.)
- The agreeing nations consented to creating a monitoring framework to track progress toward reaching their shared commitments.
- $200 billion a year will be mobilized for safeguarding biodiversity by 2030, doubling the previous Aichi baseline.
The Aichi Biodiversity Targets called on nations to protect at least 17 percent of terrestrial and inland water and 10 percent of coastal and marine areas, as well as to meet 19 other objectives. These goals remained largely unachieved by their target date of 2020.
We must ensure that this new, more ambitious agreement does not reach the same fate. To do that, we need to use established metrics and the latest geospatial technology to rigorously monitor progress.
Achieving Targets by Measuring Progress
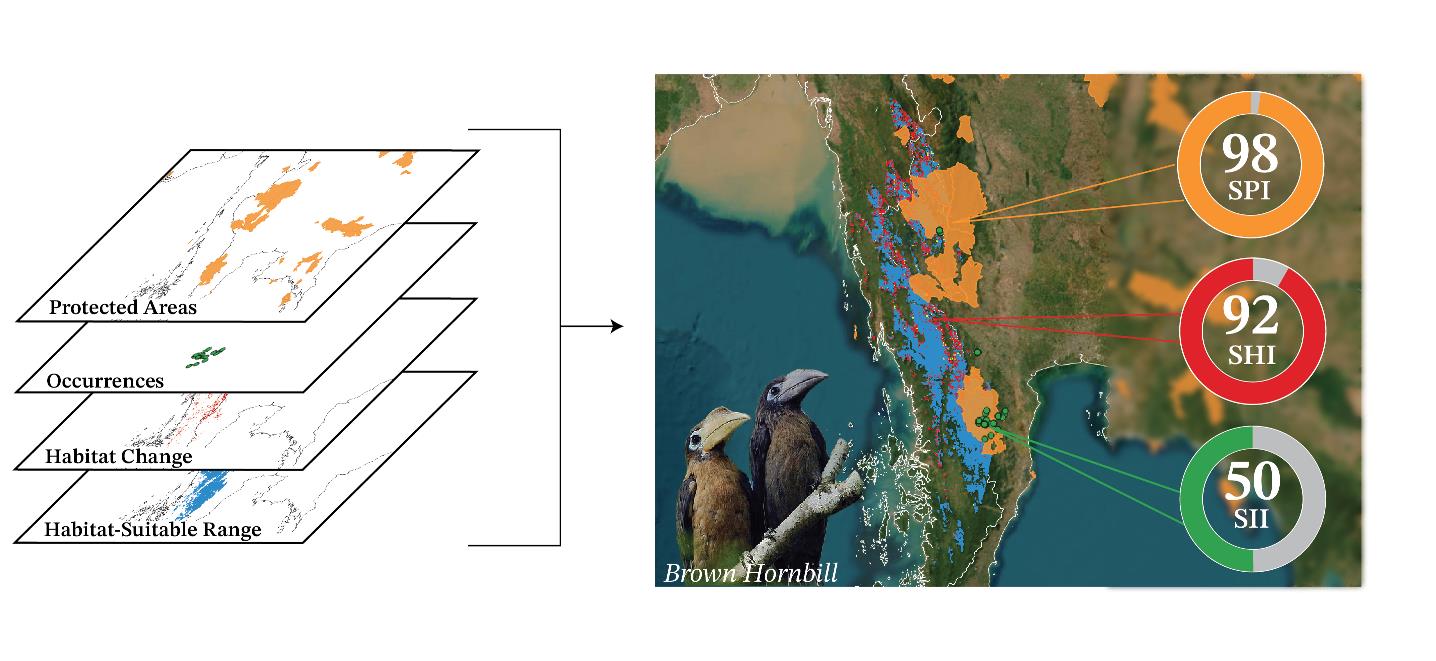
The brown hornbill has lost 8 percent of its habitat area and connectivity since 2001 (red), but it has near-adequate protection in conservation areas (orange). Monitoring efforts for the species need to be improved (green).
There is hope that the key beneficiaries of past losses of nature now recognize their responsibility for the problems that the world’s ecosystems currently face.
In the GBF, parties have made greater (yet still insufficient) resource commitments in support of countries with the strongest conservation burden—that is, those where high biodiversity coincides with the critical need for economic growth.
Perhaps the most significant sign that leaders are committed to achieving the 2030 goals might be the adoption of a monitoring framework that formally recognizes the importance of measuring progress toward these shared commitments.
Specifically, the GBF Monitoring Framework requires countries to use standardized indicators of biodiversity change to quantitatively track the status and trends of ecosystems and species.
Unlike with the previous agreement from 13 years ago, it is now possible to take comparative and increasingly robust measurements of biodiversity change at the global scale.
This is thanks to rapidly growing biodiversity data, vast flows of information from ever more sophisticated earth-orbiting satellites, and the immense advances that those within the GIS community have made—all of which have enabled the global biodiversity monitoring and science community to take major steps forward.
Much of this progress has been facilitated by the Group on Earth Observations’ Biodiversity Observation Network (GEO BON). This group has encouraged the use of Essential Biodiversity Variables (EBVs)—such as genetic differentiation or species population sizes measured over time—as core spatiotemporally explicit variables supporting the development of high-level biodiversity indicators.
A New Generation of Biodiversity Indicators
A good case in point consists of three GEO BON biodiversity indicators based on EBVs and developed by Yale University’s Map of Life, a global platform for assessing species distributions and their changes.
They are the Species Habitat Index (SHI), the Species Protection Index (SPI), and the Species Information Index (SII). These indices were produced in partnership with Esri; the E. O. Wilson Biodiversity Foundation; and other technology and funding partners including Google, the National Aeronautics and Space Administration (NASA), and the National Geographic Society. All three indices were formally adopted in the GBF Monitoring Framework.
The indicators are geospatial metrics that track the population health and conservation status of species, plus the adequacy of monitoring efforts for those species, based on measurements taken for tens of thousands of single species. The metrics can be calculated at any level with available information, but particularly powerful insight arises when they are developed and standardized globally.
These calculations start with employing top-of-the-line species distribution models to derive best-possible estimates of species’ geographic ranges—an effort at the heart of Map of Life.
Available at mol.org, Map of Life integrates a range of distribution data types and resources with remotely sensed environmental layers in spatial models to derive 1 kilometer- and finer-resolution predictions of their occurrences.
From there, each indicator uses additional data on remotely sensed land-cover change (from the SHI), expansions of the protected area network (from the SPI), and data on growth in species occurrence (from the SII). The SHI scores the sizes, connectivity, and genetic diversity of species populations relative to a reference period.
The SPI measures how adequately species are represented in conservation areas. And the SII captures how well field observations represent the distribution of species.
Combining Measurement with Decision Support
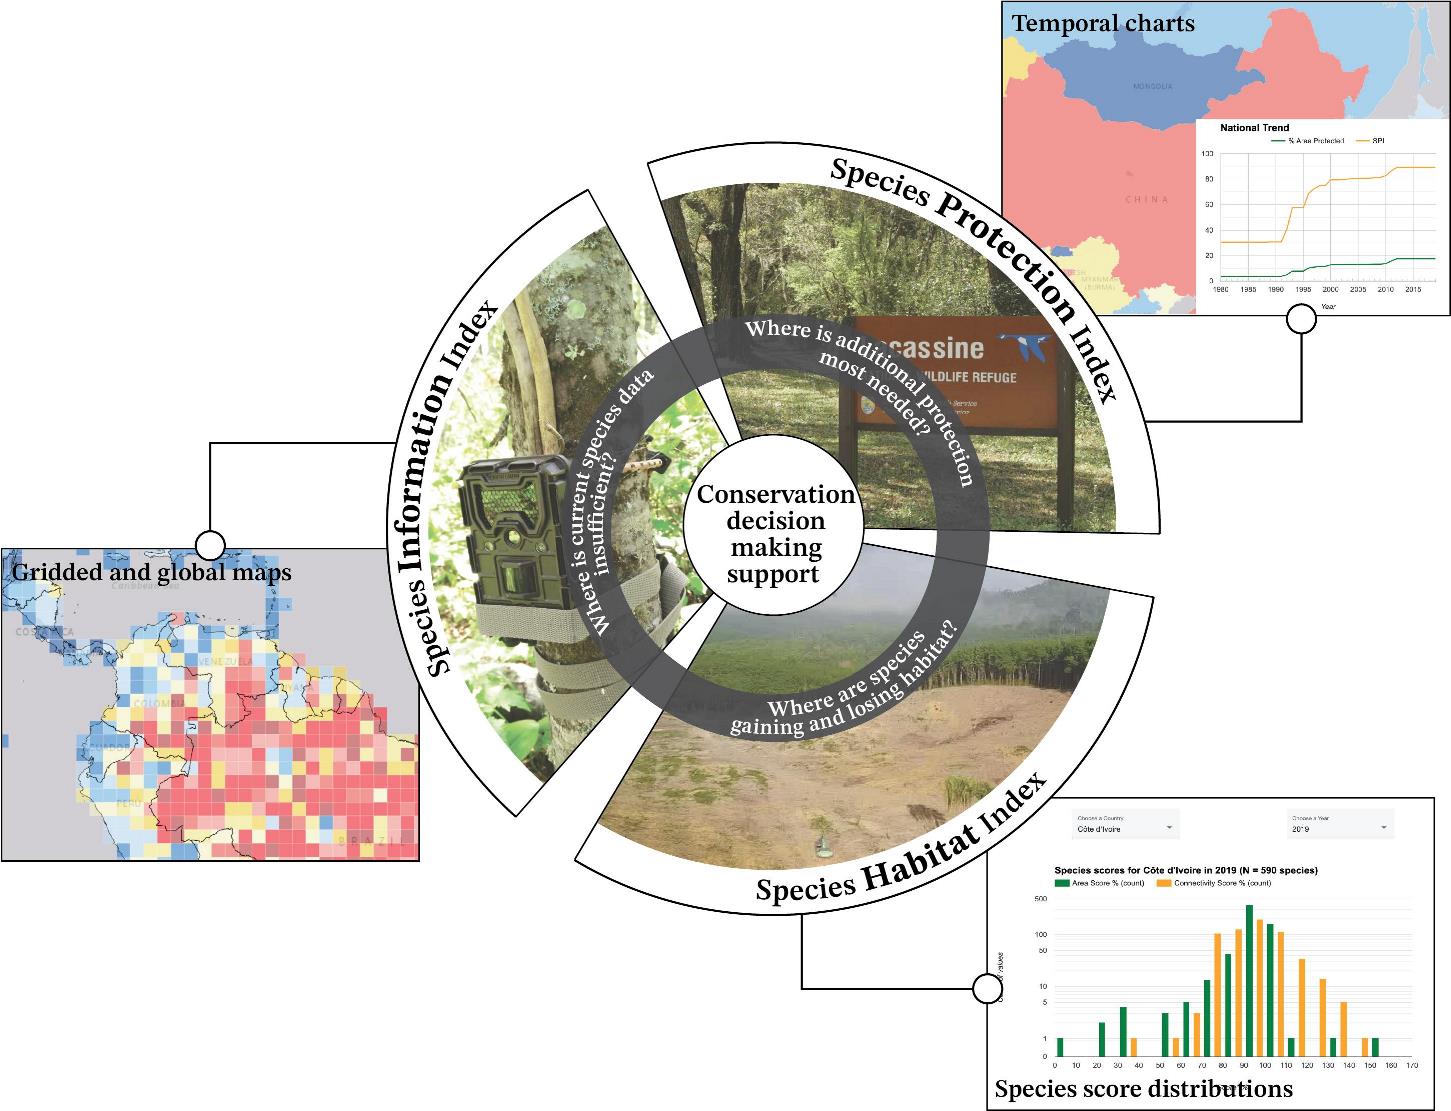
The Species Habitat Index (SHI), SPI, and Species Information Index (SII) form a simple yet robust framework for supporting decision-making in conservation.
More than offering measurement, the indicators provide support for decision-making.
Thanks to their detailed, map-based nature, researchers can identify the exact areas where a species is losing habitat, where additional protected areas would be most effective, and where further data collection efforts are needed.
In addition, the three indicators are even more powerful when used together. Using the SII to advance targeted data collection improves the information available on the distribution of species, which leads to more accurate calculations of the SHI and SPI.
When the SHI gains timely insight into habitat change, this can help inform protected area planning. And combining the habitat and protection scores provided by the SHI and SPI, respectively, can help researchers identify protected areas that continue to face habitat loss, as well as potential areas to target for restoration and subsequent protection.
On the Map of Life website, anyone can explore detailed information for tens of thousands of species across all countries.
For example, people can see where the brown hornbill has faced the most severe habitat loss.
Or they can examine the countries in which the zebra duiker’s habitat is sufficiently covered by protected area networks.
Or they can see the regions in Bolivia where biodiversity is critically undersampled.
This array of information can greatly help countries track their progress toward attaining the GBF goals and initiate effective, data-driven conservation actions.
The Half-Earth Project Map
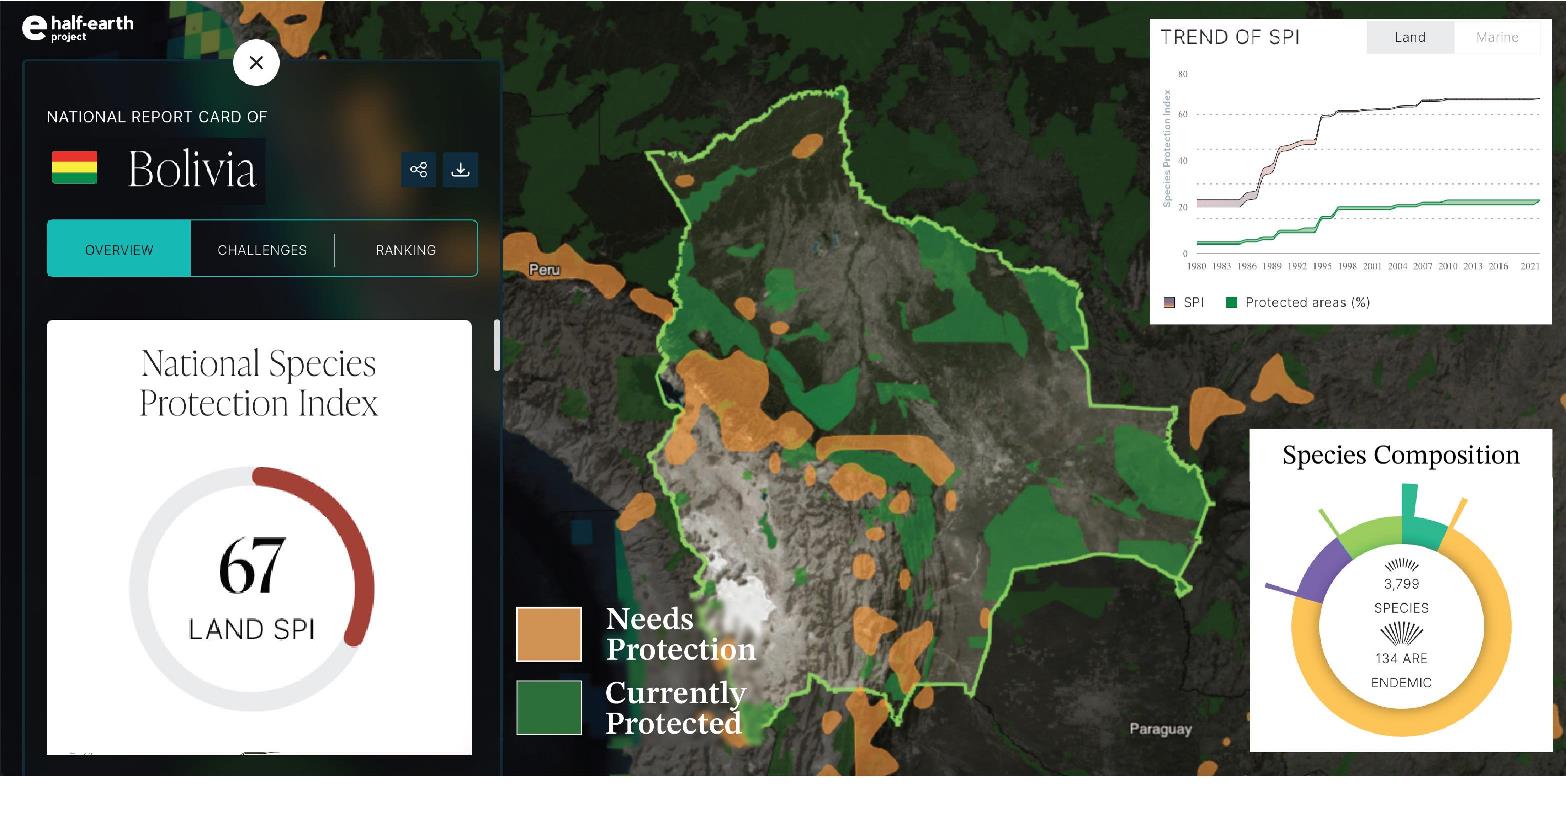
The Half-Earth Project’s National Report Card for Bolivia shows which areas of the country are protected and which parts need to be conserved, plus the composition of species there and trends in the national Species Protection Index (SPI).
For the most comprehensive information on the priorities of and progress in area-based conservation, head to the Half-Earth Project Map at map.half-earthproject.org.
E. O. Wilson’s research on island biogeography and his subsequent book, Half-Earth: Our Planet’s Fight for Life, inspired the 30×30 target that’s part of the GBF.
This is the initiative to protect 30 percent of land, sea, and freshwater by 2030 to safeguard biodiversity. The central metric for measuring progress around 30×30 is the SPI, which gauges how well existing protected area networks cover species’ habitats and where new additions to networks have the greatest potential to conserve biodiversity.
Open and accessible to all, the Half-Earth Project Map, which was developed in close partnership with Esri, also offers National Report Cards for each nation. These include statistics on the composition of species in the country, temporal gains in protection, and areas that are being prioritized for future conservation.
Additionally, site visitors can explore the unique challenges each country faces on the road to achieving a high SPI and compare various countries in global rankings.
Another feature of the Half-Earth Project Map is the Area of Interest tool, which lets users get similar biodiversity reports for any location of interest, such as a potential new park or construction site.
For each species, users can explore a region’s relative importance to and protection adequacy for that species, its threat status, and more.
Drawing from the species data at Map of Life, this tool supports spatial conservation assessment and planning through an easy-to-use, interactive interface.
Anyone who is armed with both local knowledge and these globally relevant indicators will be better equipped to contribute to the conversations around and actions that affect various species.
Now, Go Explore
Author Dr. Walter Jetz.
The biodiversity conservation equation is multilayered.
It doesn’t just involve one species and geospatial data—it also takes into consideration the needs and rights of human communities; the assurance of continued ecosystem services; and other economic, social, and cultural concerns.
Biodiversity indicators form one crucial part of this equation.
When humans weave these biodiversity indicators into their decision-making processes alongside other factors, the world will inevitably achieve the greatest results for biodiversity, people, and the planet.

Author Tamara Rudic.
To get engaged with these projects, head to mol.org/indicators and map.half-earthproject.org.
There, you can investigate the three biodiversity indicators and explore ways to get involved with GBF efforts.
For more information, email Dr. Walter Jetz of Yale University at walter.jetz@yale.edu.
About the Authors
Dr. Walter Jetz is a professor of ecology and evolutionary biology and of the environment at Yale University. He leads Map of Life and directs the Yale Center for Biodiversity and Global Change, which creates knowledge and tools for understanding biodiversity dynamics and guiding conservation decisions. Tamara Rudic is the science communication specialist for the Yale Center for Biodiversity and Global Change.
Featured photo by Alain Audet from Pixabay
This article originally appeared in ArcNews, a publication of Esri. Reprinted here (with minor edits) by permission.